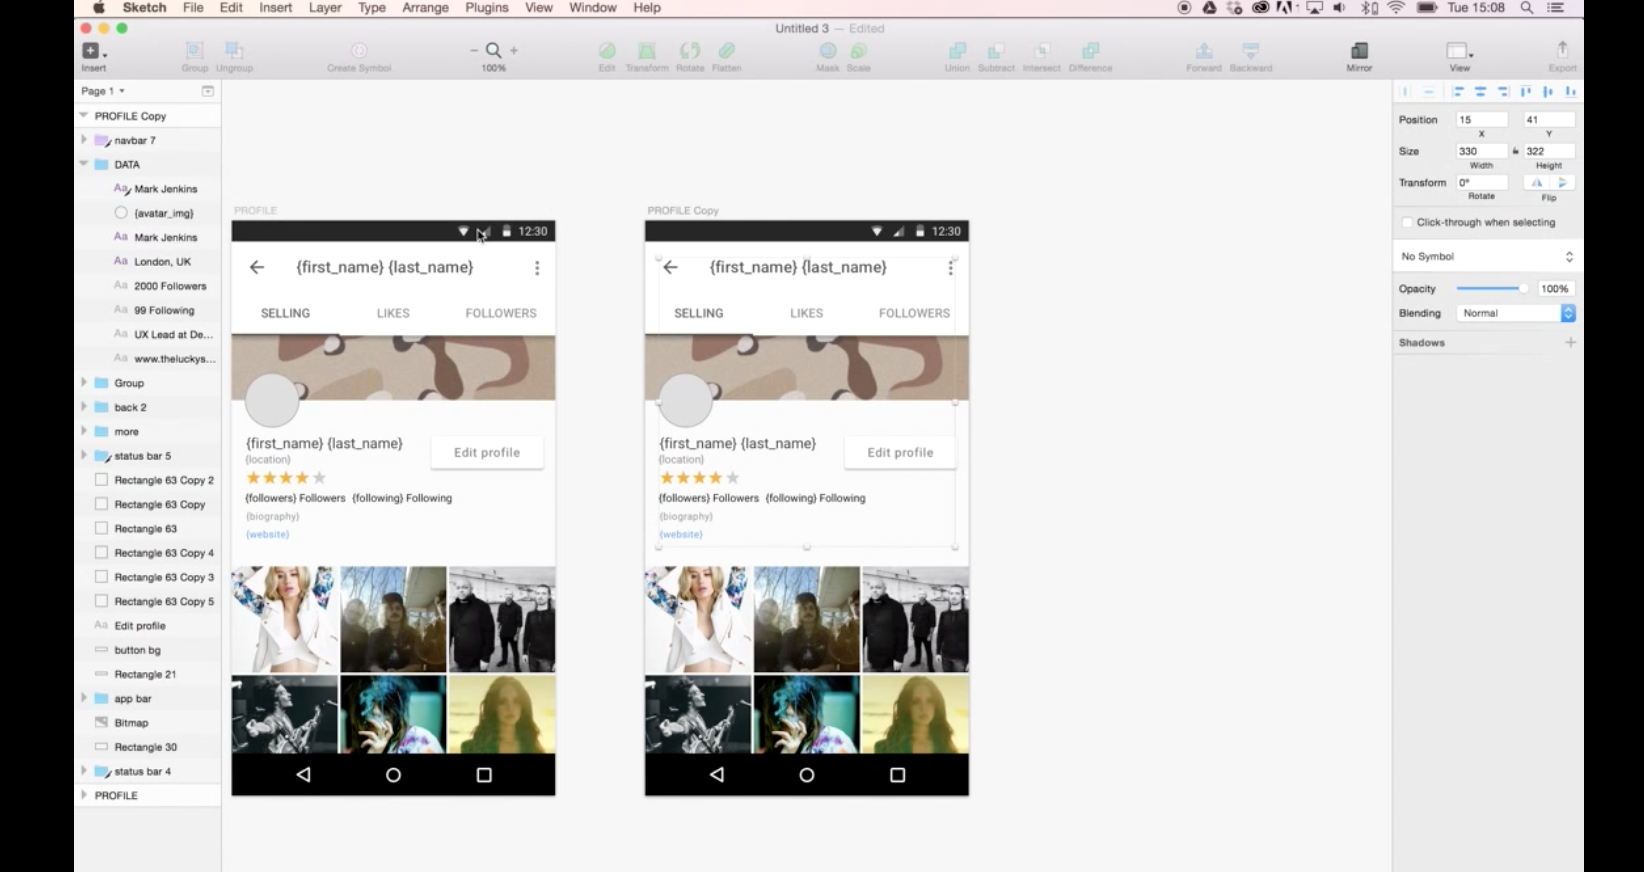
How to use real data with Sketch. Needs plugins.
Using Precious Design Studio and Lukas Ondrej’s Sketch Data Populator plugin we were able to quickly prototype a template for the profile view and use a JSON file to add real data to the design.
How to use real data with Sketch. Needs plugins.
Using Precious Design Studio and Lukas Ondrej’s Sketch Data Populator plugin we were able to quickly prototype a template for the profile view and use a JSON file to add real data to the design.
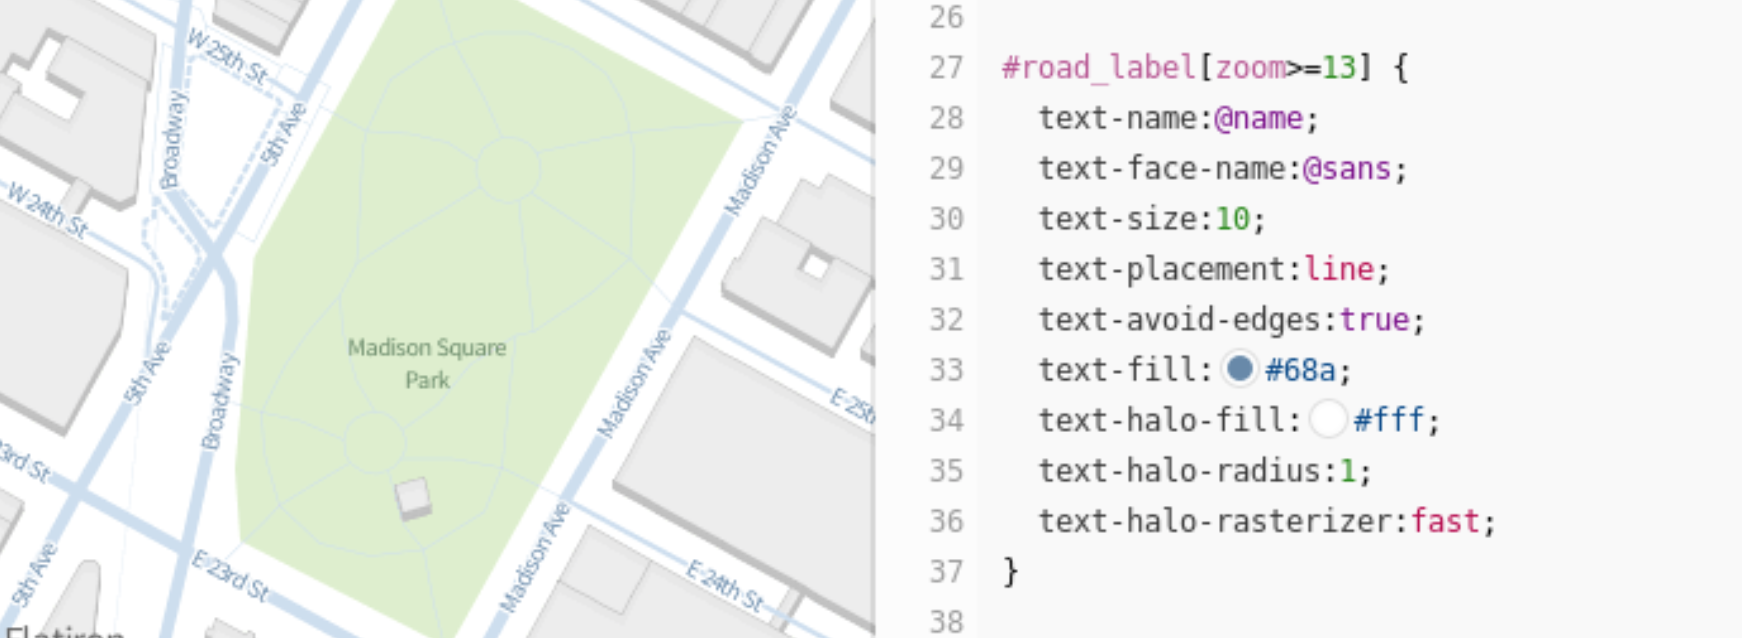
Mapbox Studio uses a language called CartoCSS to determine the look of a map. Colors, sizes, and shapes can all be manipulated by applying their specific CartoCSS parameters in the stylesheet panel to the right of the map. Read the CartoCSS manual for a more detailed introduction to the language…
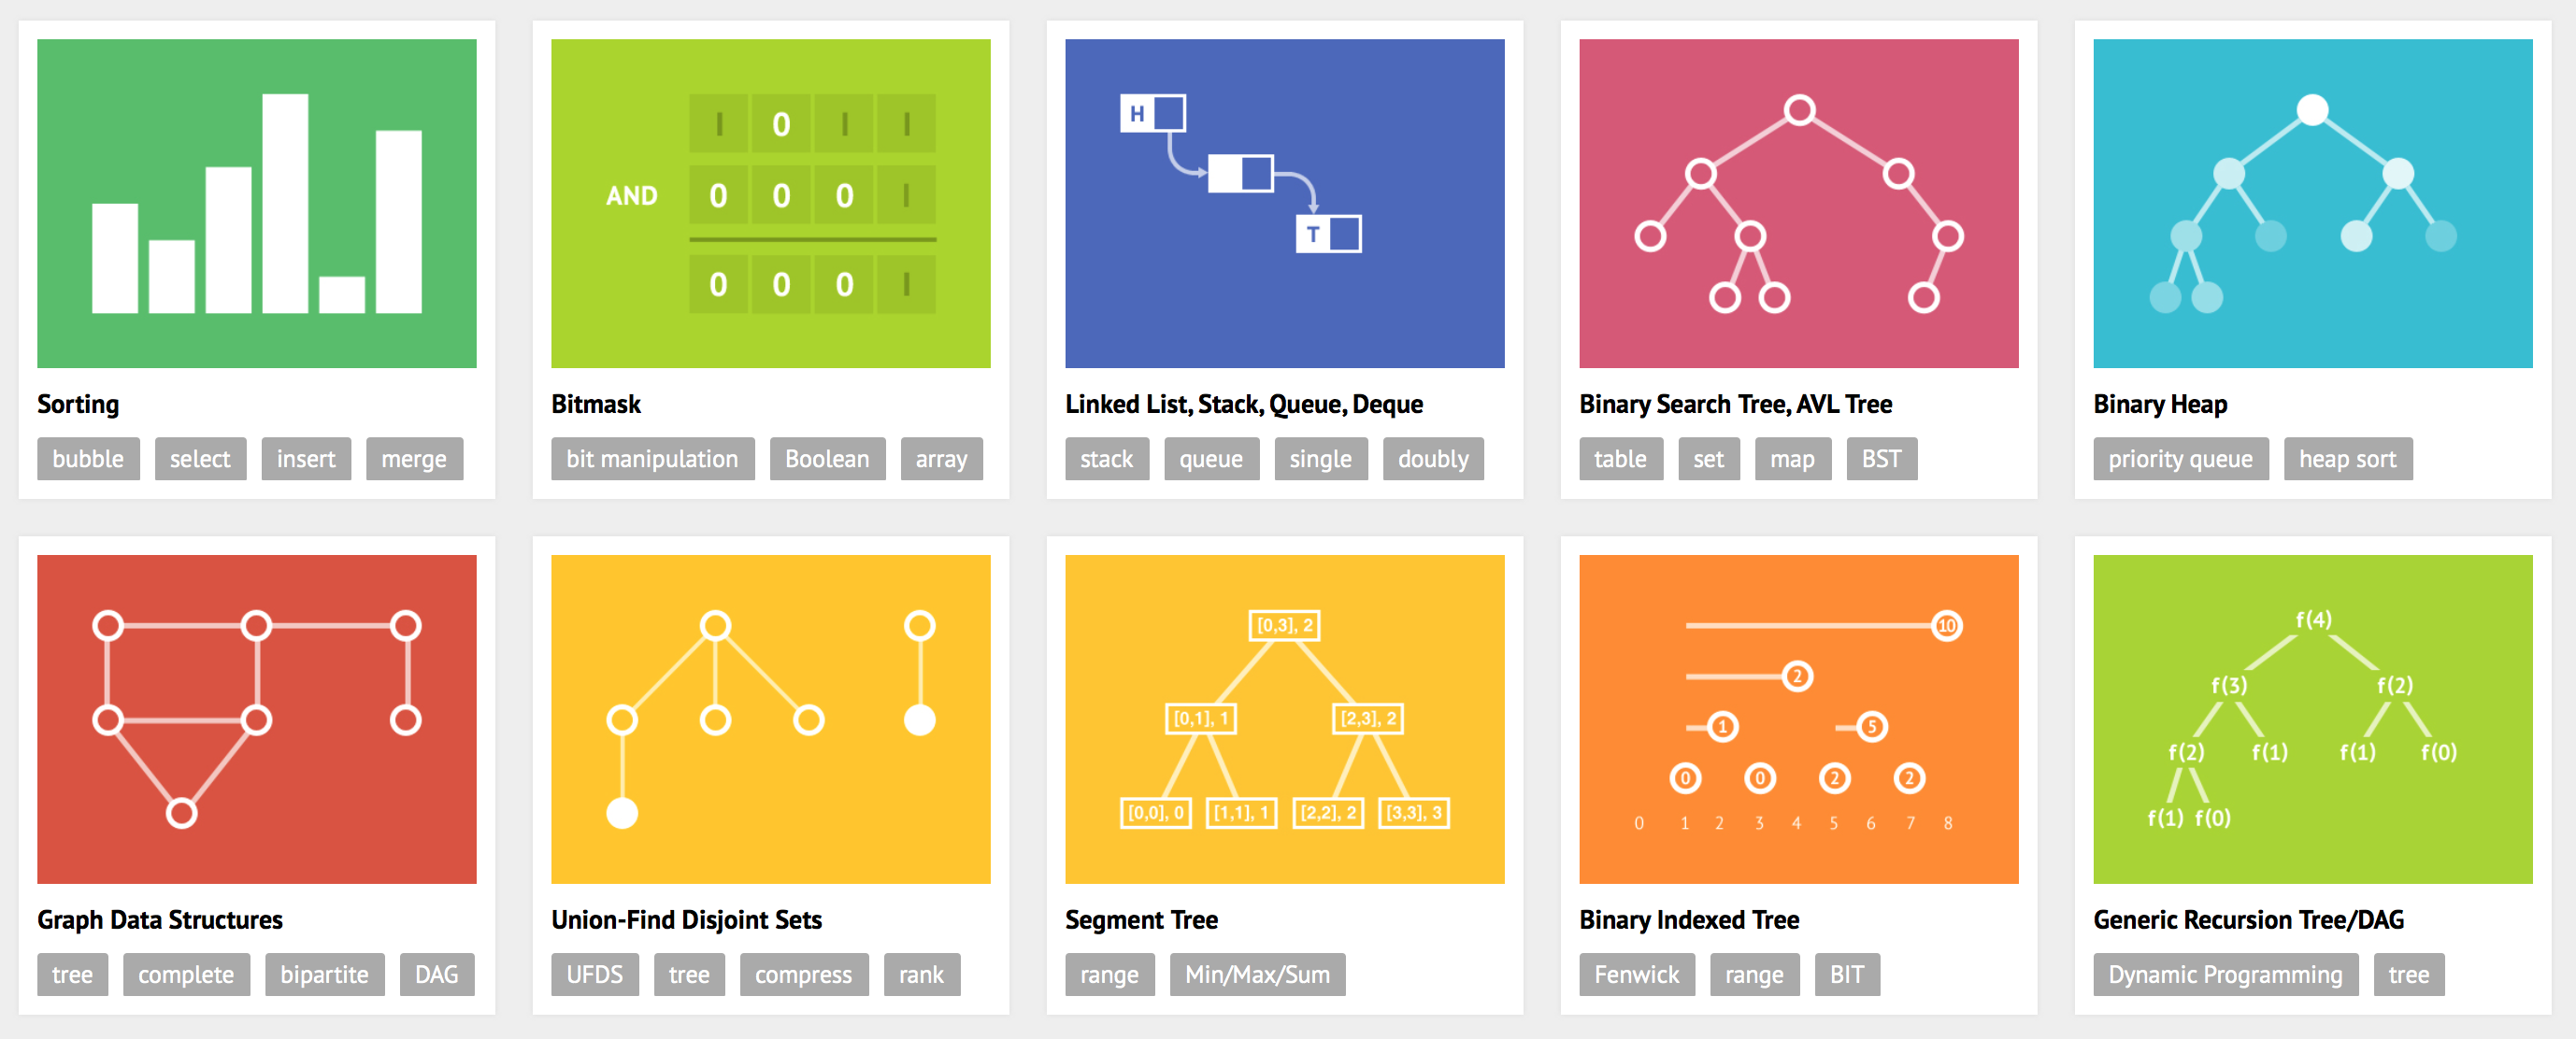
VisuAlgo was conceptualised in 2011 by Dr Steven Halim as a tool to help his students better understand data structures and algorithms, by allowing them to learn the basics on their own and at their own pace. VisuAlgo is like a 24/7 copy of himself. Together with some of his students from the National University of Singapore (see the “Team”), a series of visualisations were developed and consolidated, from simple sorting algorithms to complex graph data structures and algorithms, and also string+geometry algorithms.
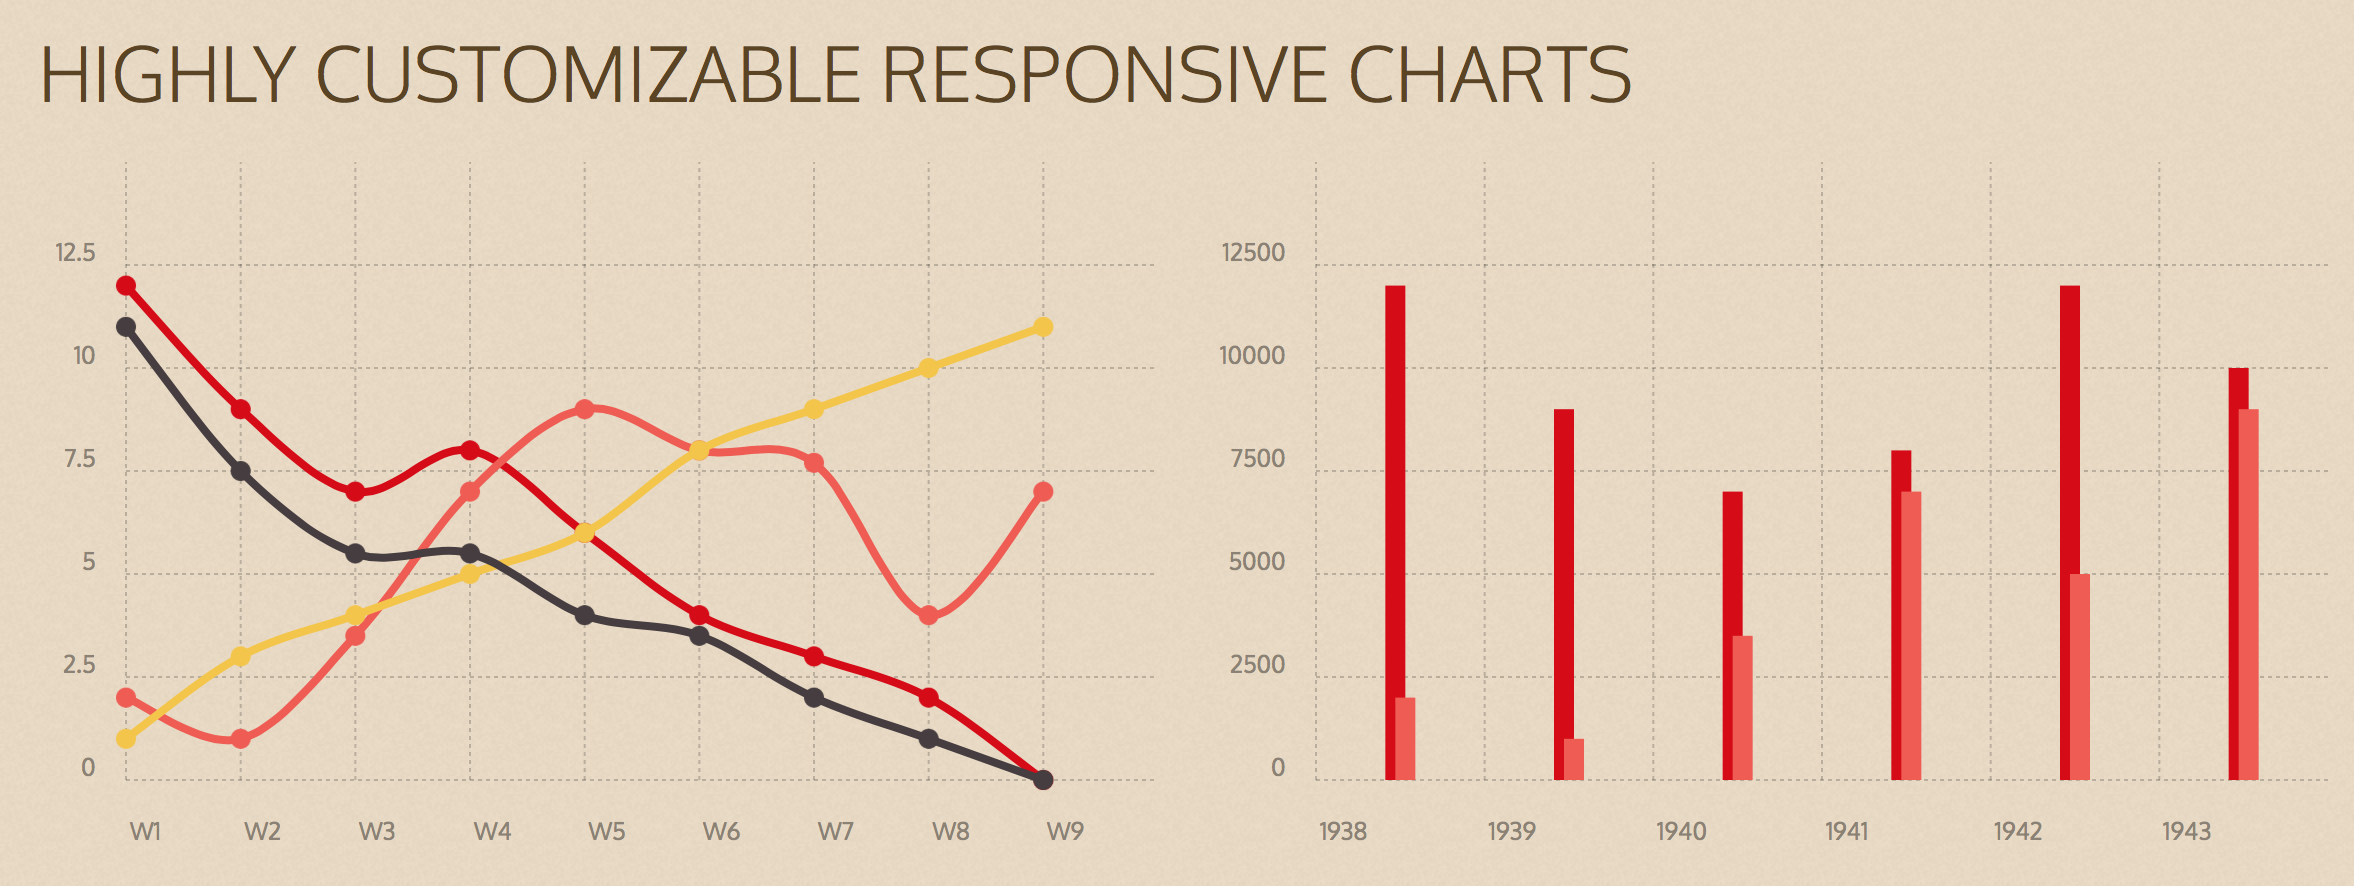
Chartist.js is a simple responsive charting library built with SVG. There are hundreds of nice charting libraries already out there, but they are either:
- not responsive
- use the wrong technologies for illustration (canvas)
- are not flexible enough while keeping the configuration simple
- are not friendly to your own code
- are not friendly to designers
- have unnecessary dependencies to monolithic libraries
- more annoying things
That’s why we have started Chartist.js and our goal is to solve all of the above issues.
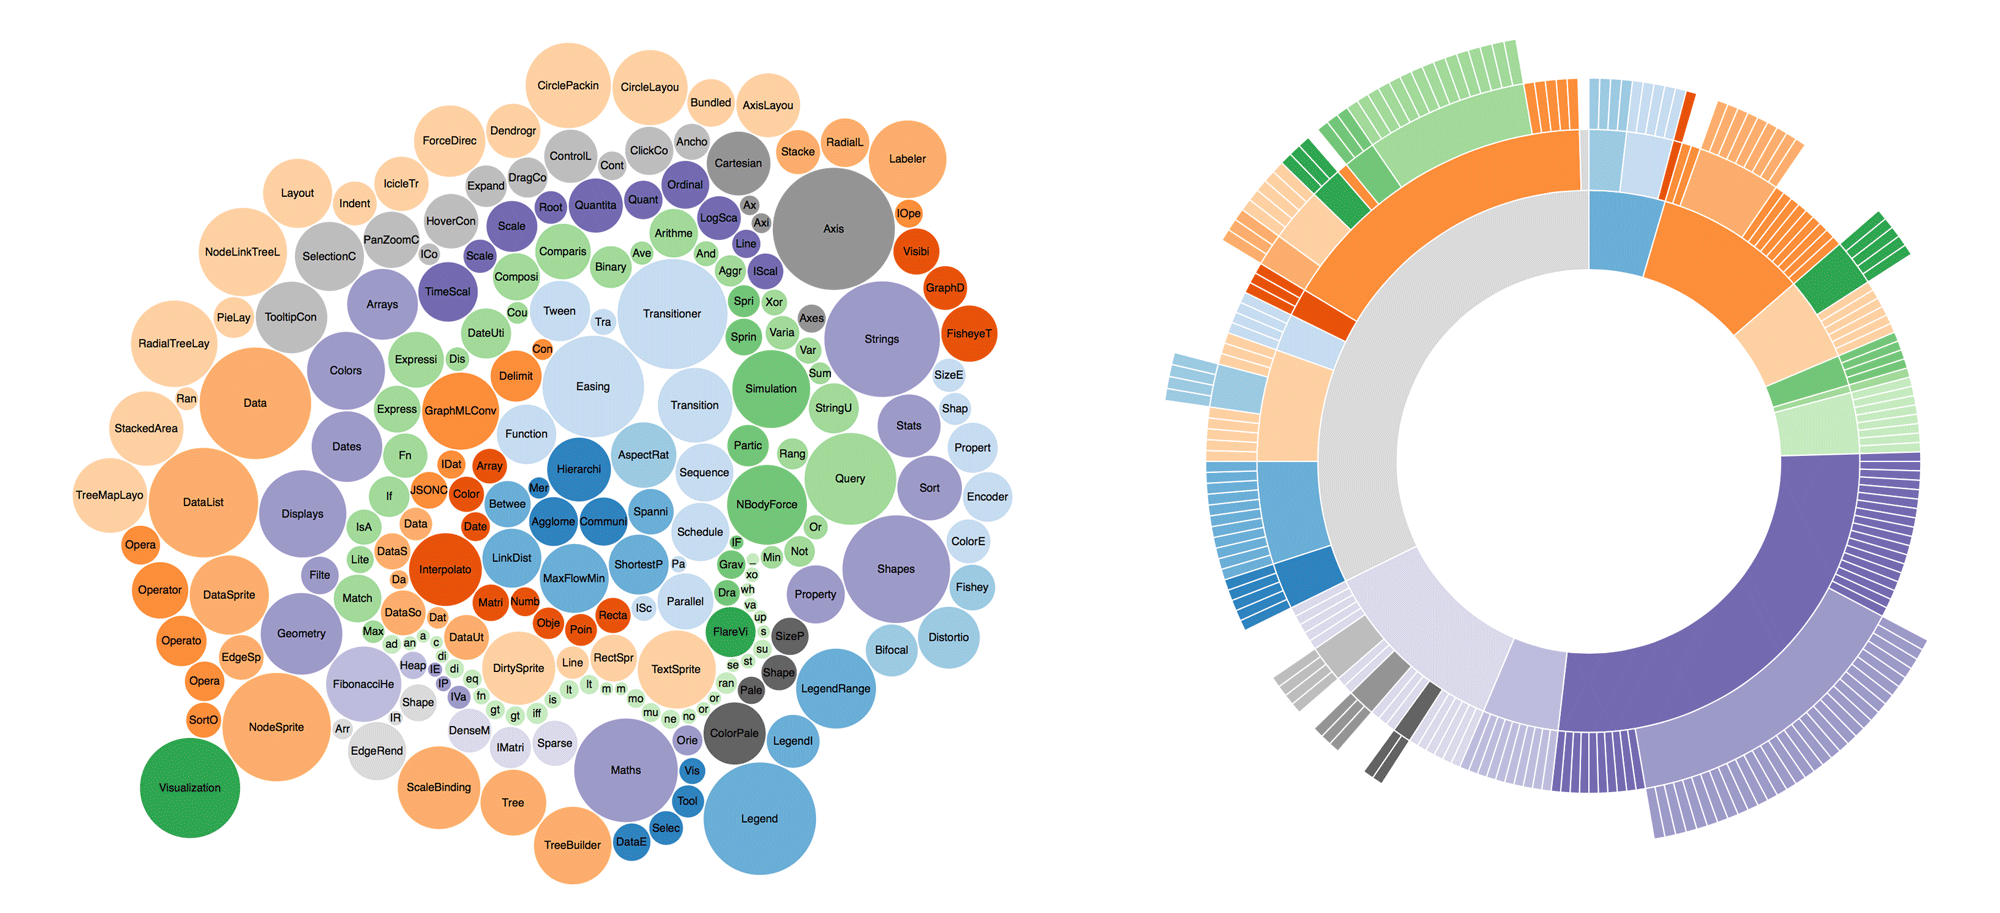
D3.js is a JavaScript library for manipulating documents based on data. D3 helps you bring data to life using HTML, SVG and CSS. D3’s emphasis on web standards gives you the full capabilities of modern browsers without tying yourself to a proprietary framework, combining powerful visualization components and a data-driven approach to DOM manipulation.
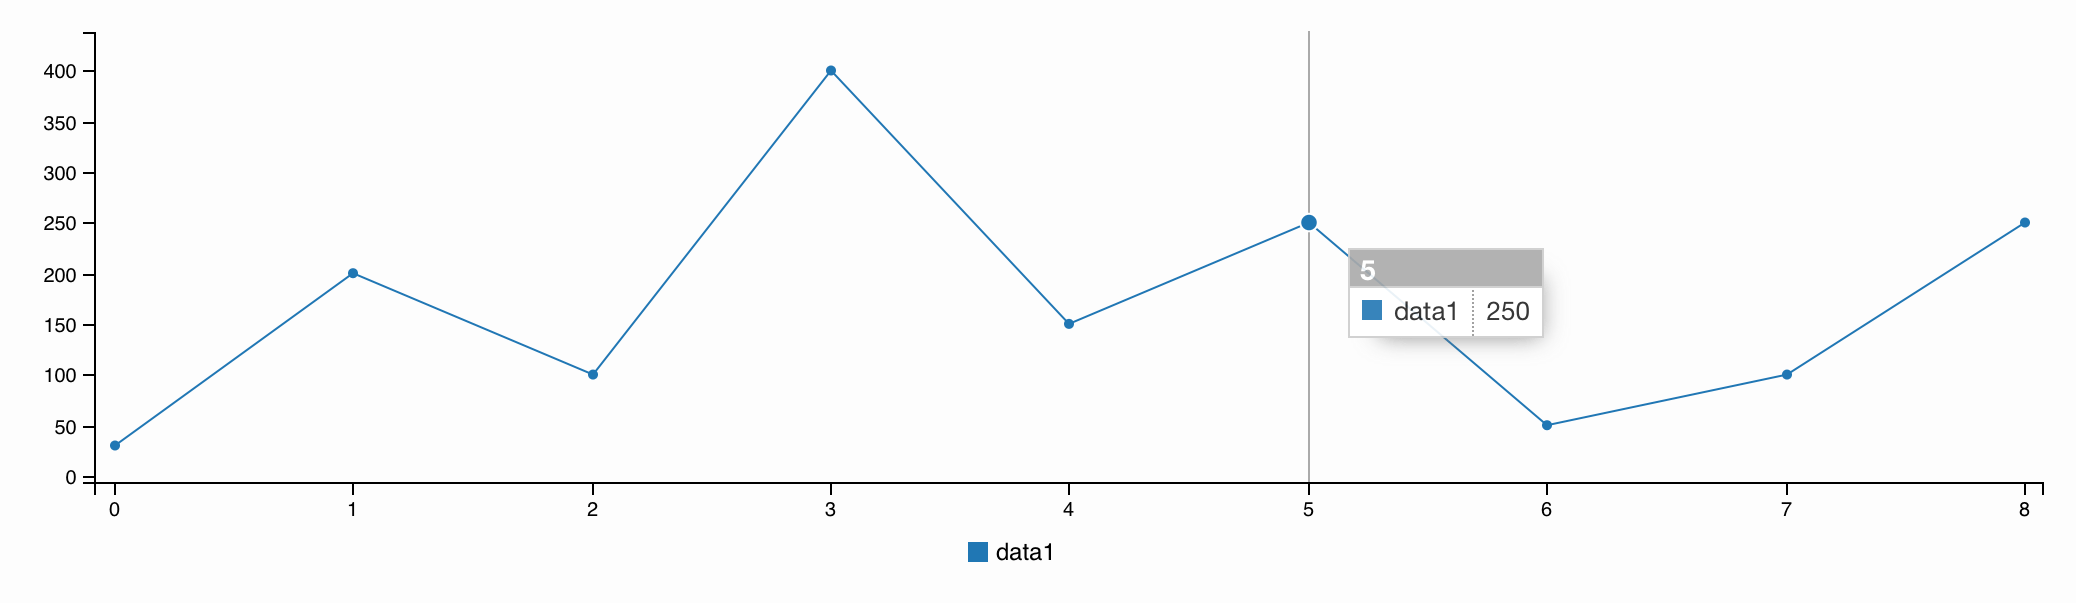
C3 makes it easy to generate D3-based charts by wrapping the code required to construct the entire chart. We don’t need to write D3 code any more.
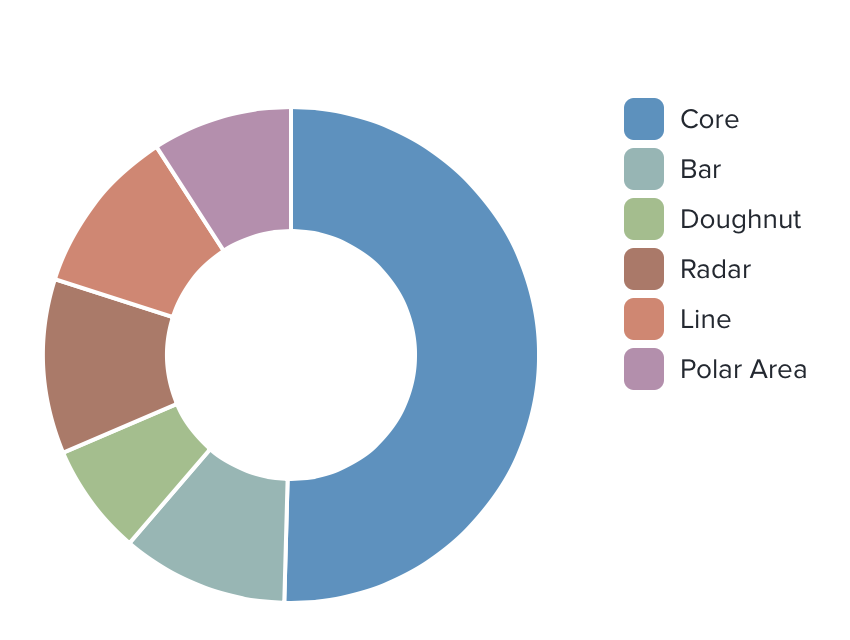 Six chart types, HTML5 based, simple and flexible, responsive, modular, interactive.