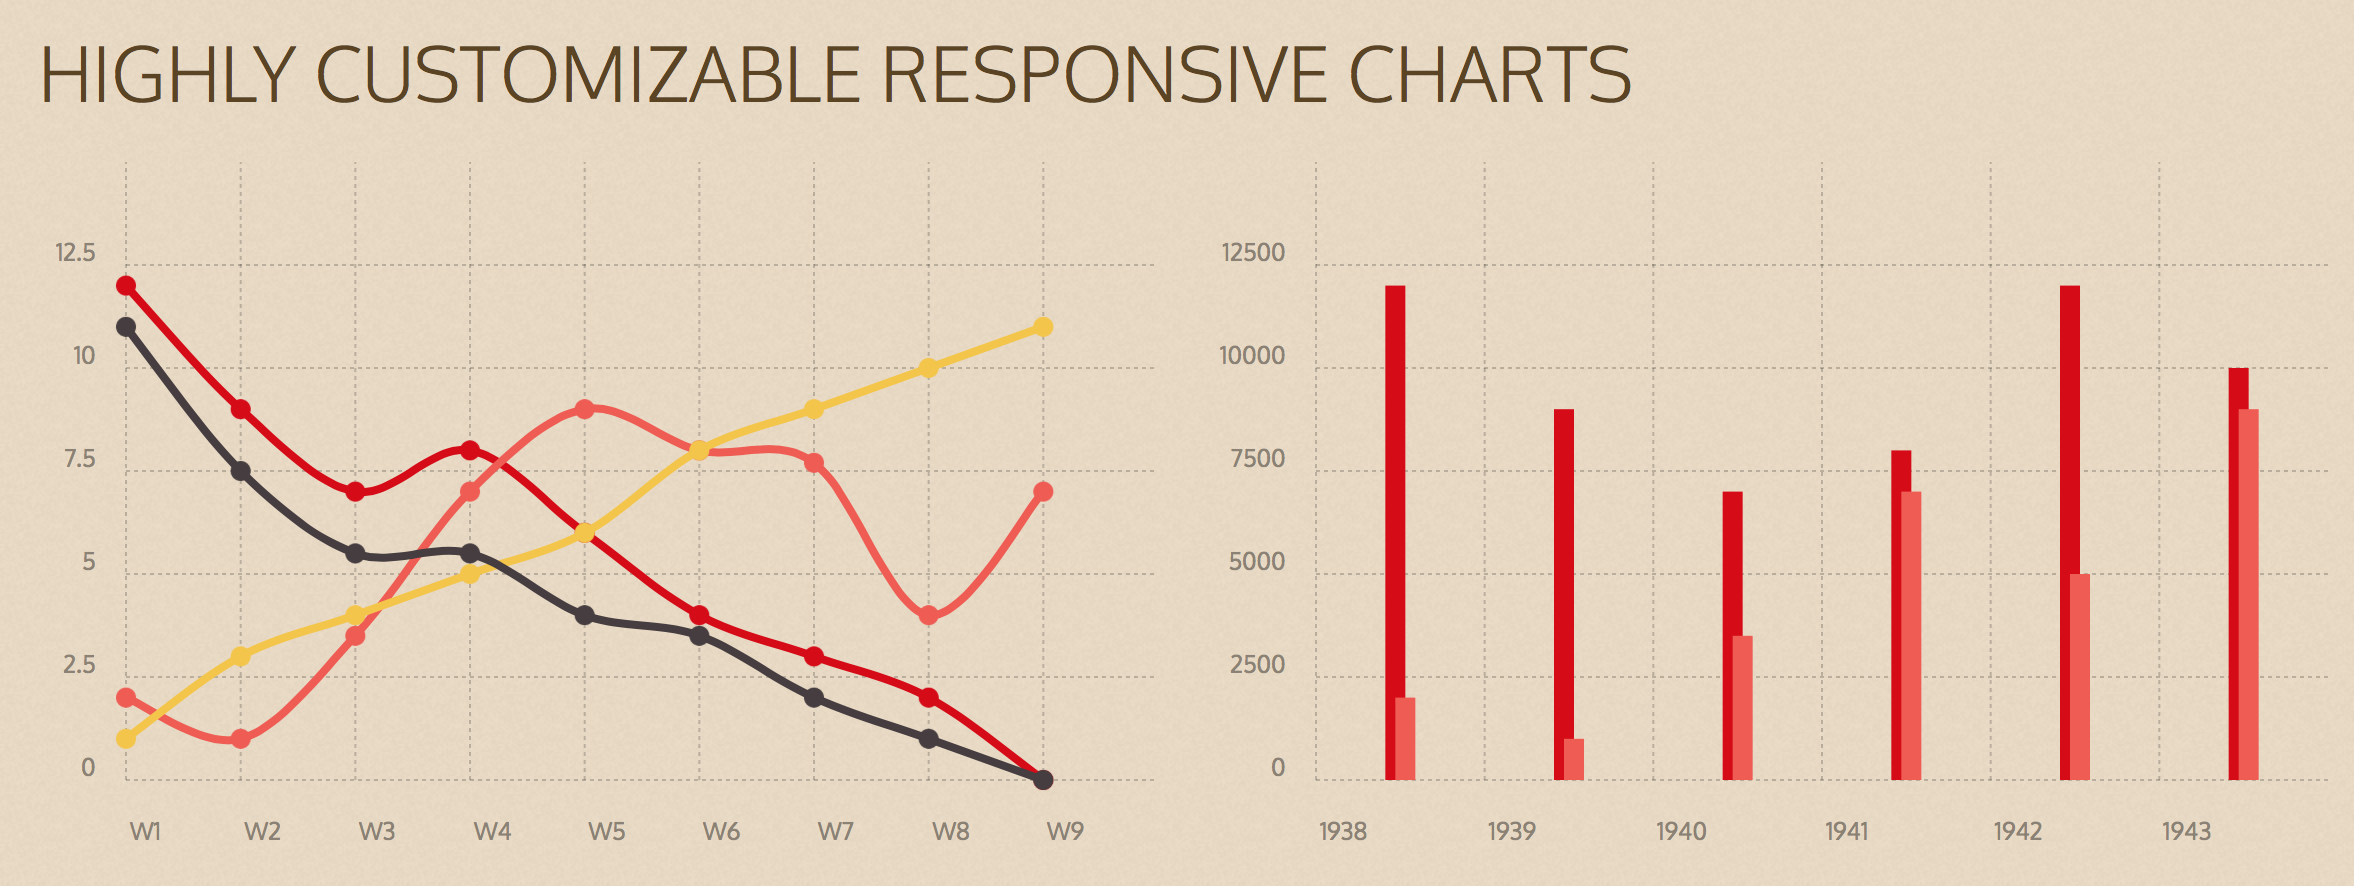
Chartist.js is a simple responsive charting library built with SVG. There are hundreds of nice charting libraries already out there, but they are either:
- not responsive
- use the wrong technologies for illustration (canvas)
- are not flexible enough while keeping the configuration simple
- are not friendly to your own code
- are not friendly to designers
- have unnecessary dependencies to monolithic libraries
- more annoying things
That’s why we have started Chartist.js and our goal is to solve all of the above issues.
