Good collection of UX resources including books, grids, publications, design museums.
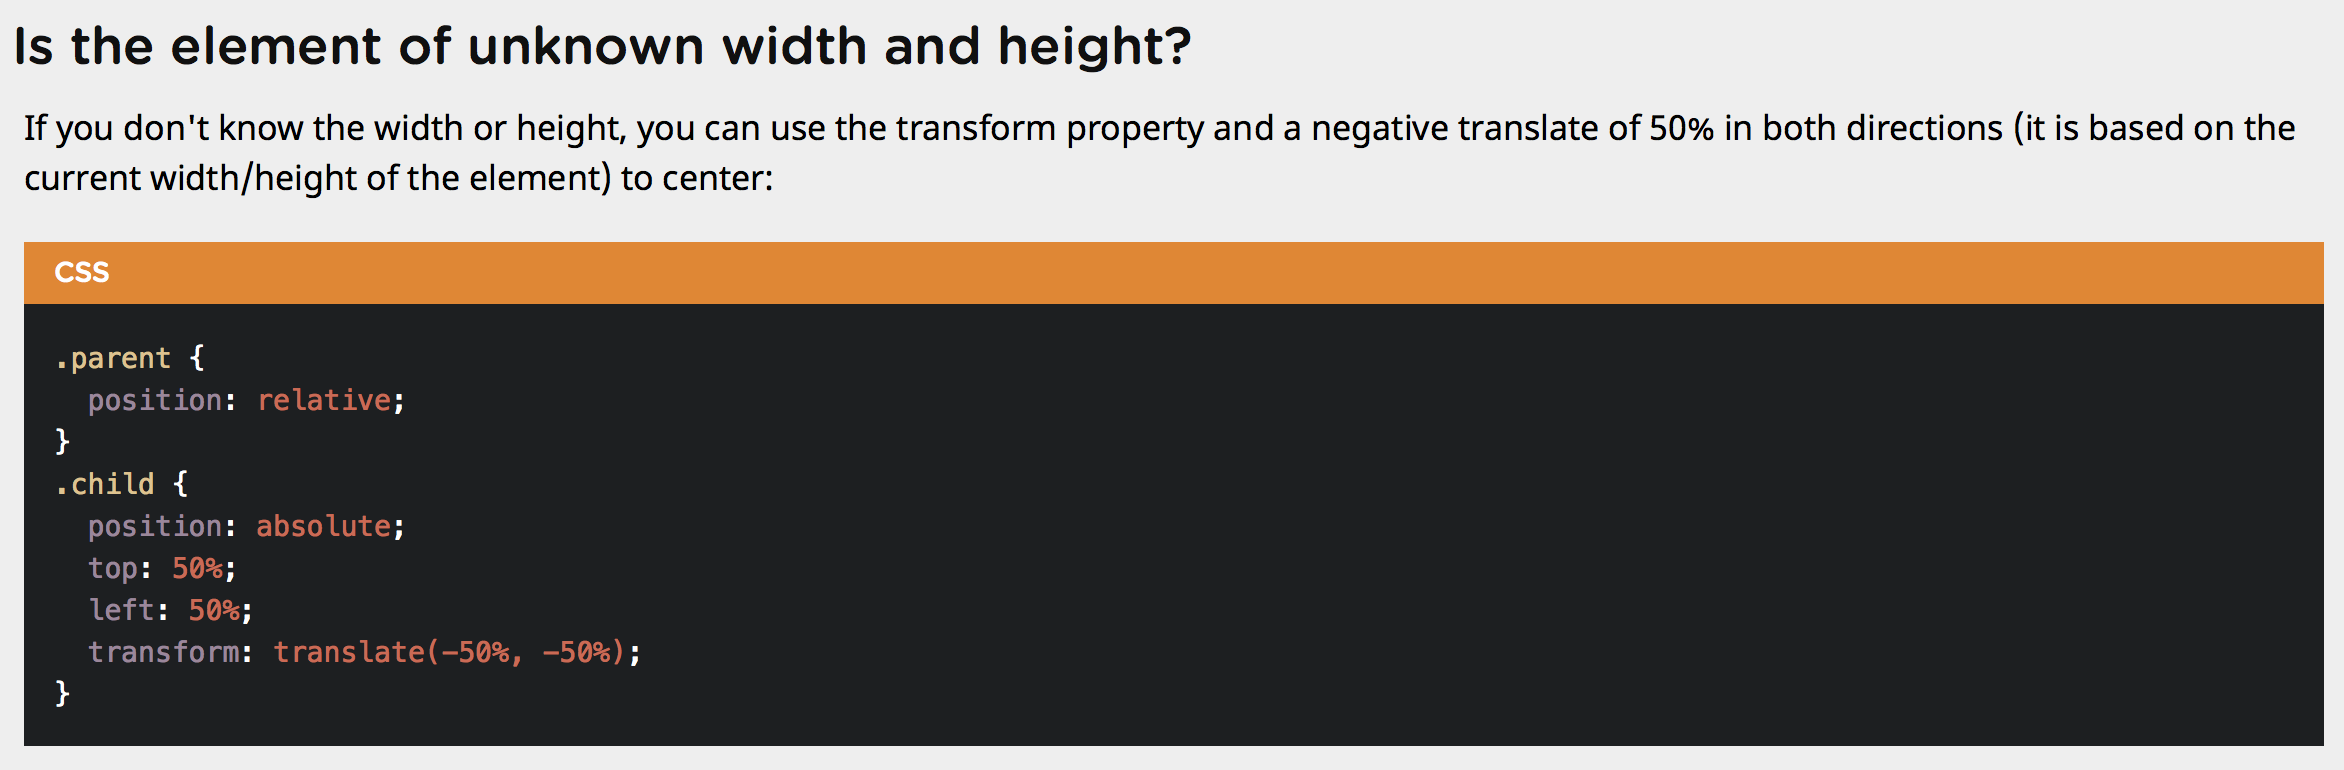
Centering in CSS: A Complete Guide
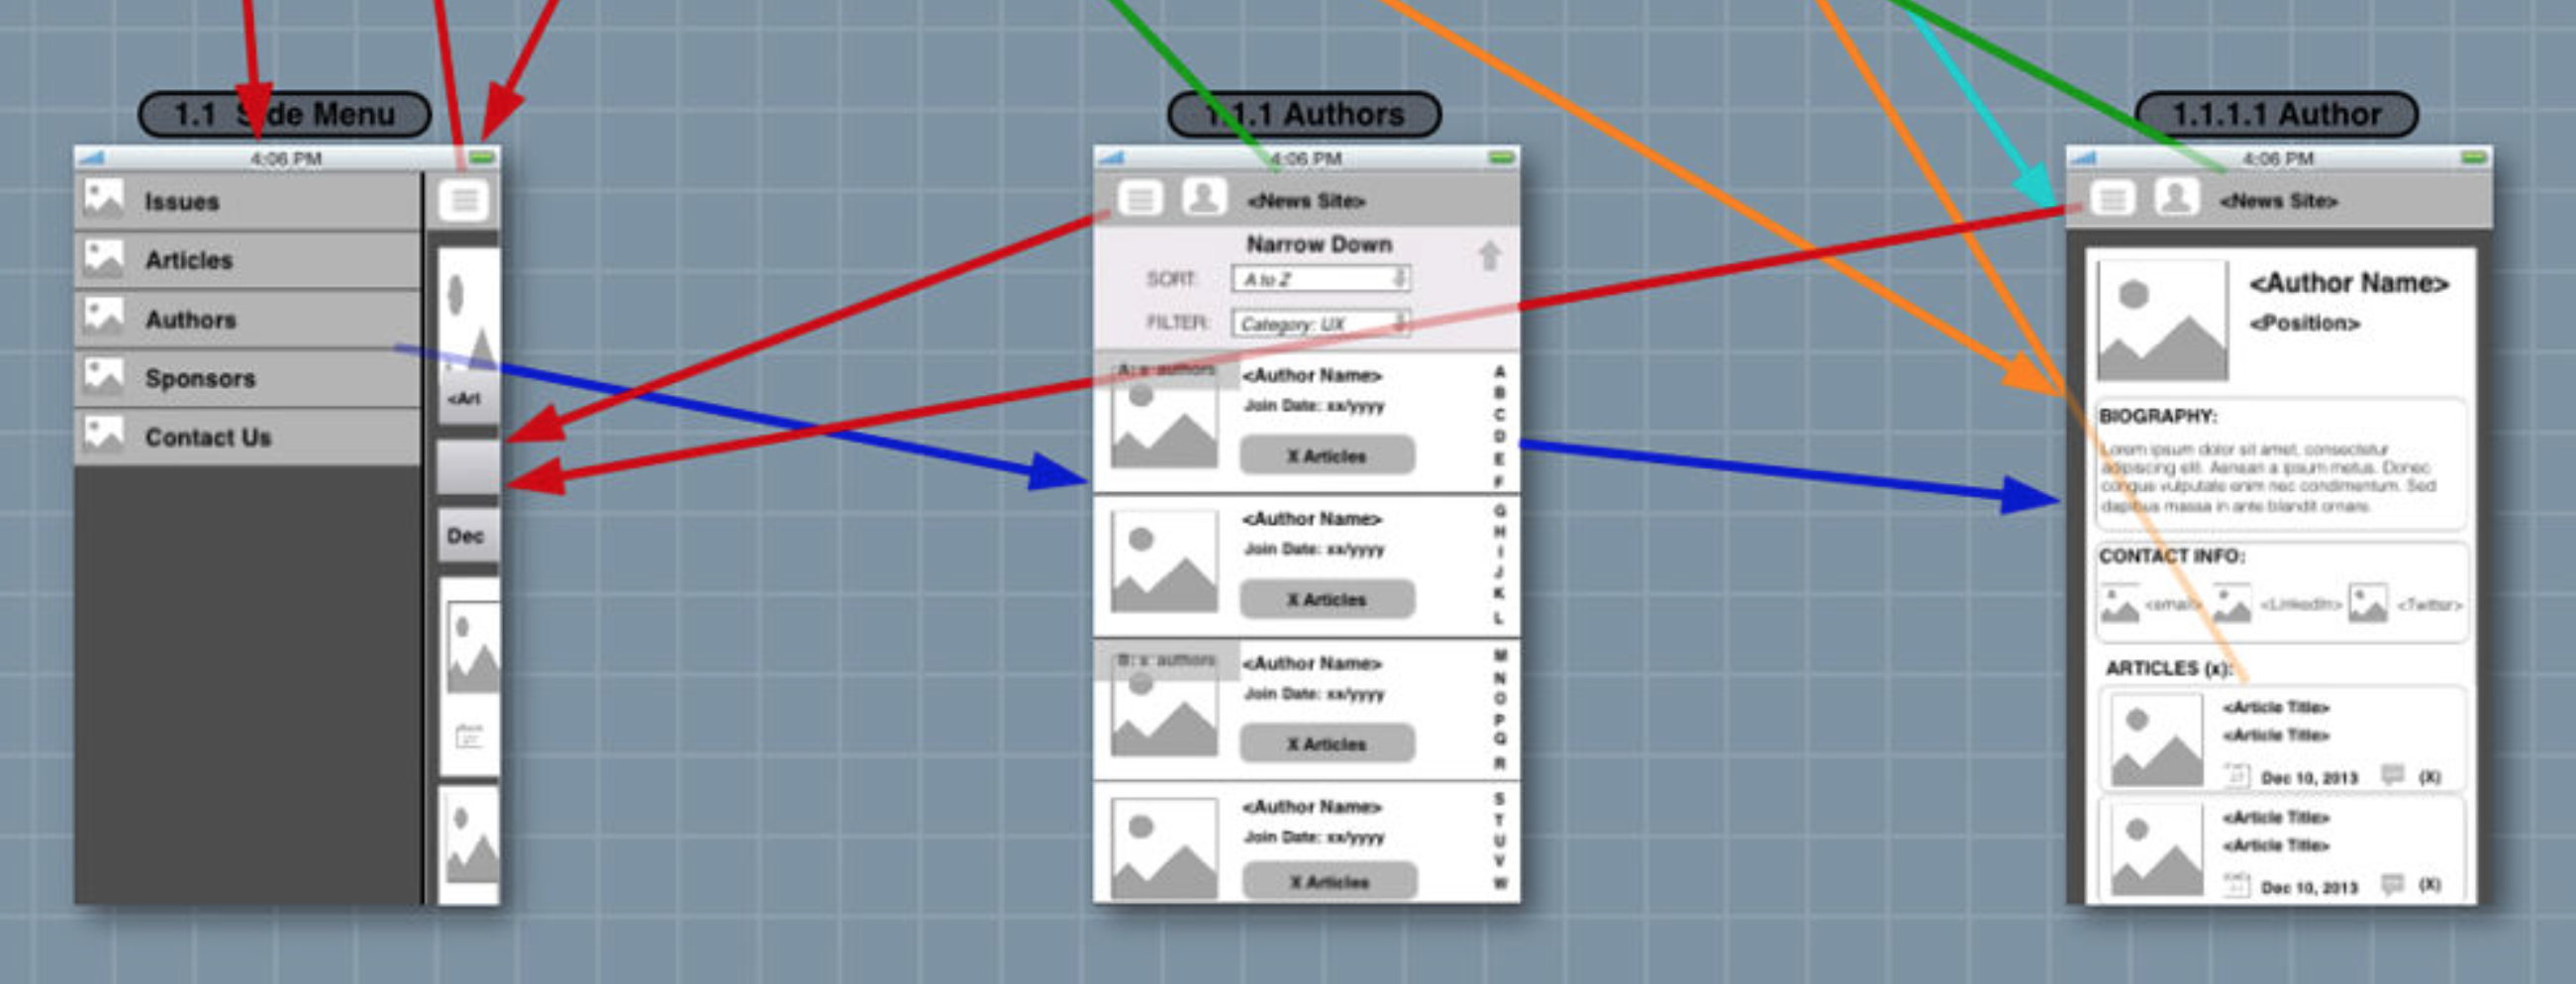
Creating Clickthrough Prototypes With Blueprint
iPad app that creates widget-based clickthrough prototypes
Blueprint, a $20 app by groosoft, enables you to create iPhone and iPad clickthrough prototypes on an iPad. The tool’s quality is best illustrated by building UIs with the ready-made widgets and the event model. The prototypes can be demoed in the application or via a free companion tool, Blueprint Viewer.
There is also Blueprint Lite, but it limits the user to two projects and no external projects. Blueprint requires no user account because prototypes are distributed as a .blueprint file, a PDF specification or a series of PNG images.
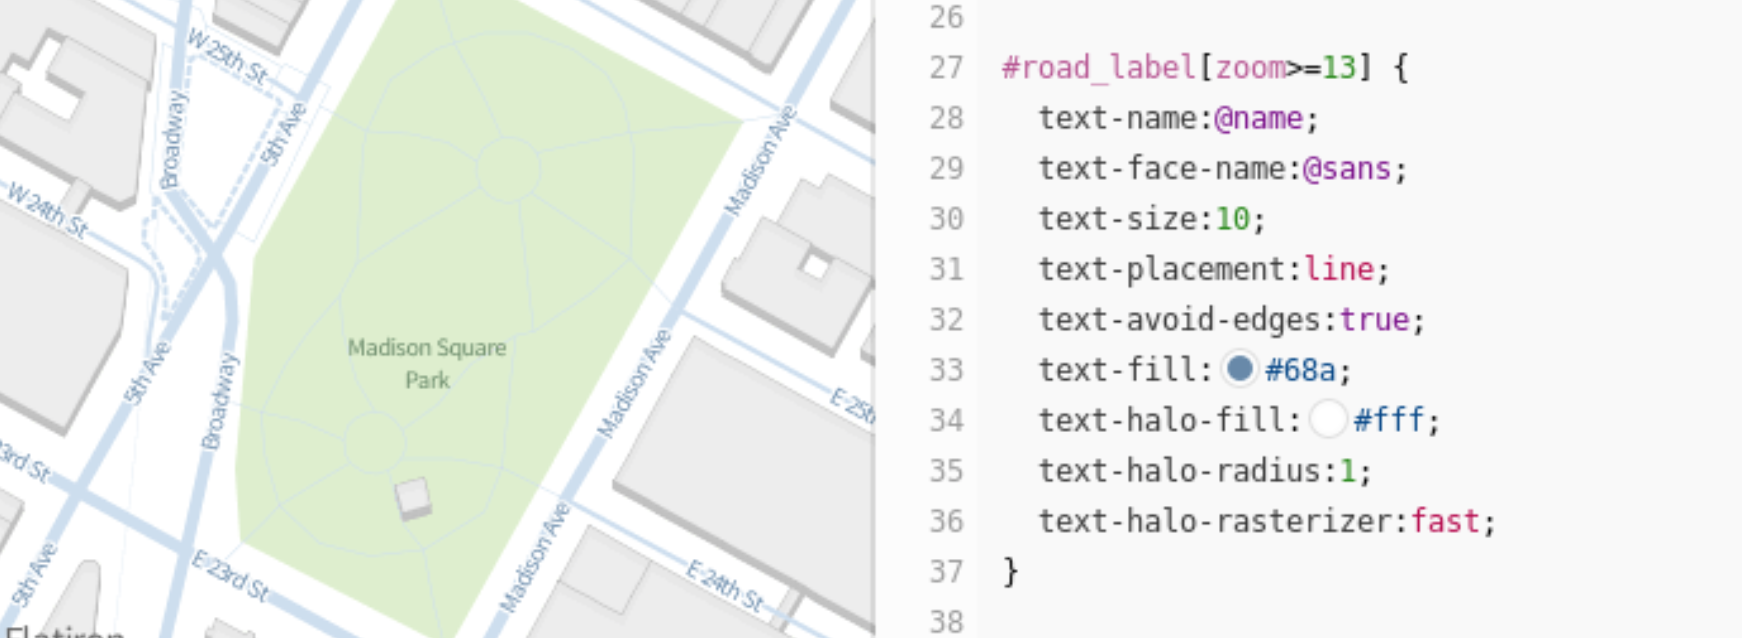
Mapbox Studio
Style quickstart:
Mapbox Studio uses a language called CartoCSS to determine the look of a map. Colors, sizes, and shapes can all be manipulated by applying their specific CartoCSS parameters in the stylesheet panel to the right of the map. Read the CartoCSS manual for a more detailed introduction to the language…
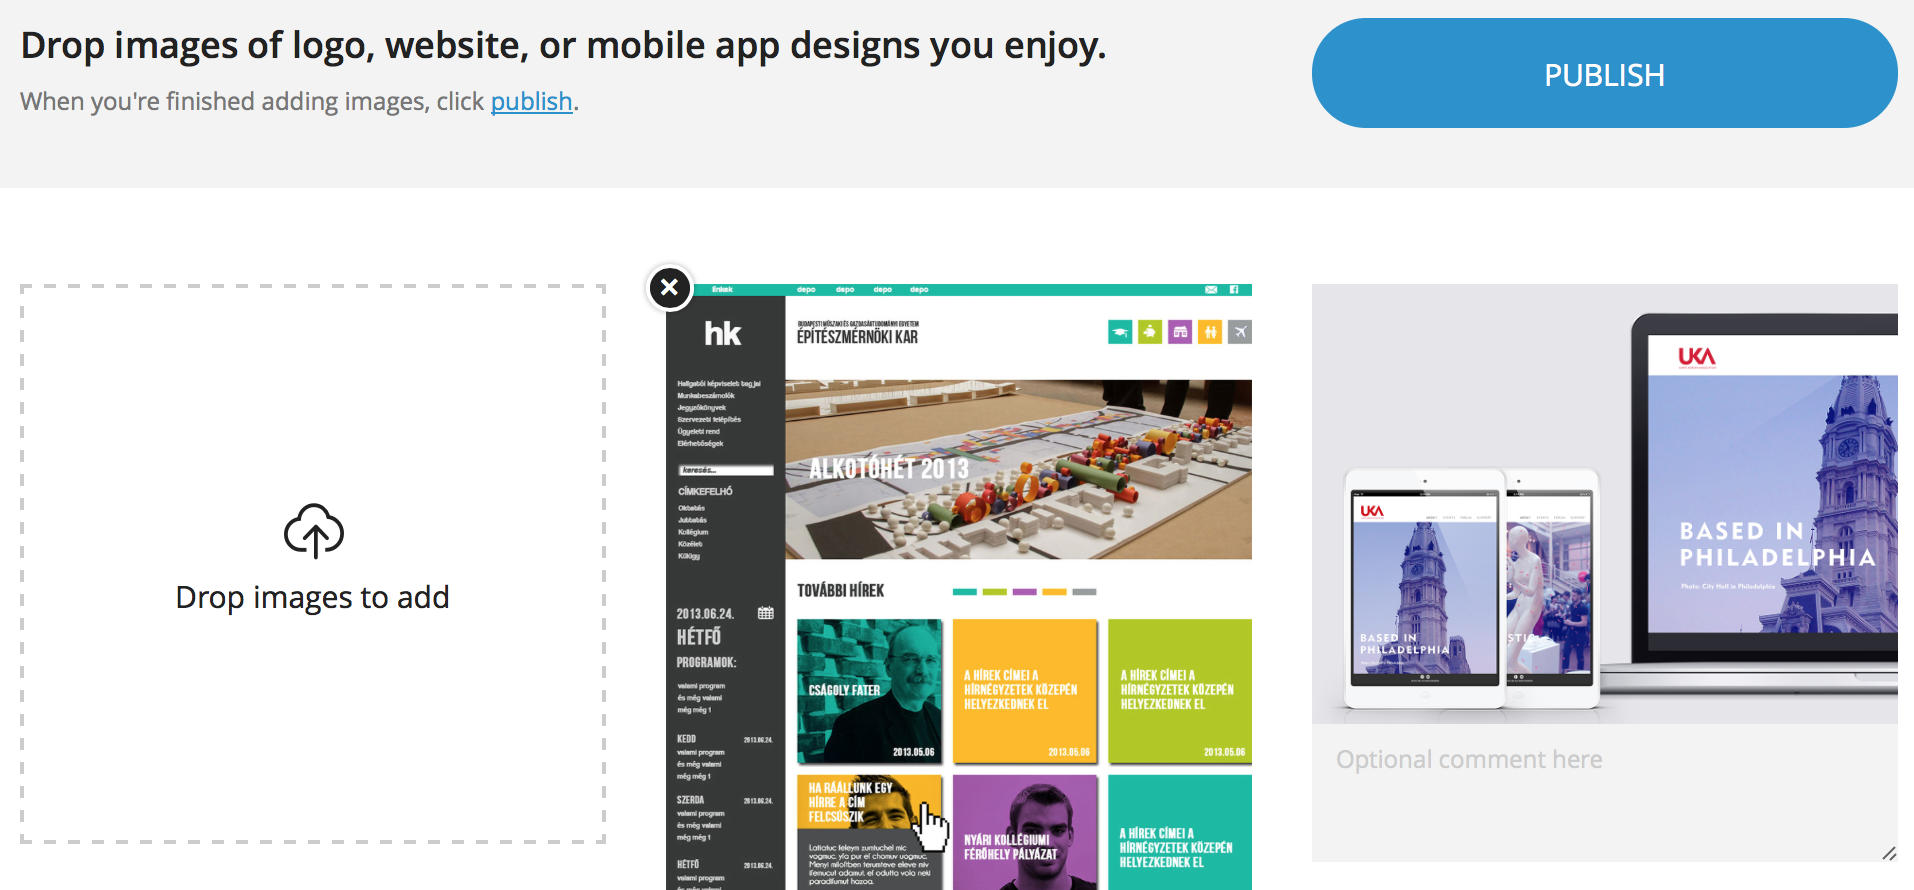
Go Moodboard – Free Online Moodboard Publishing
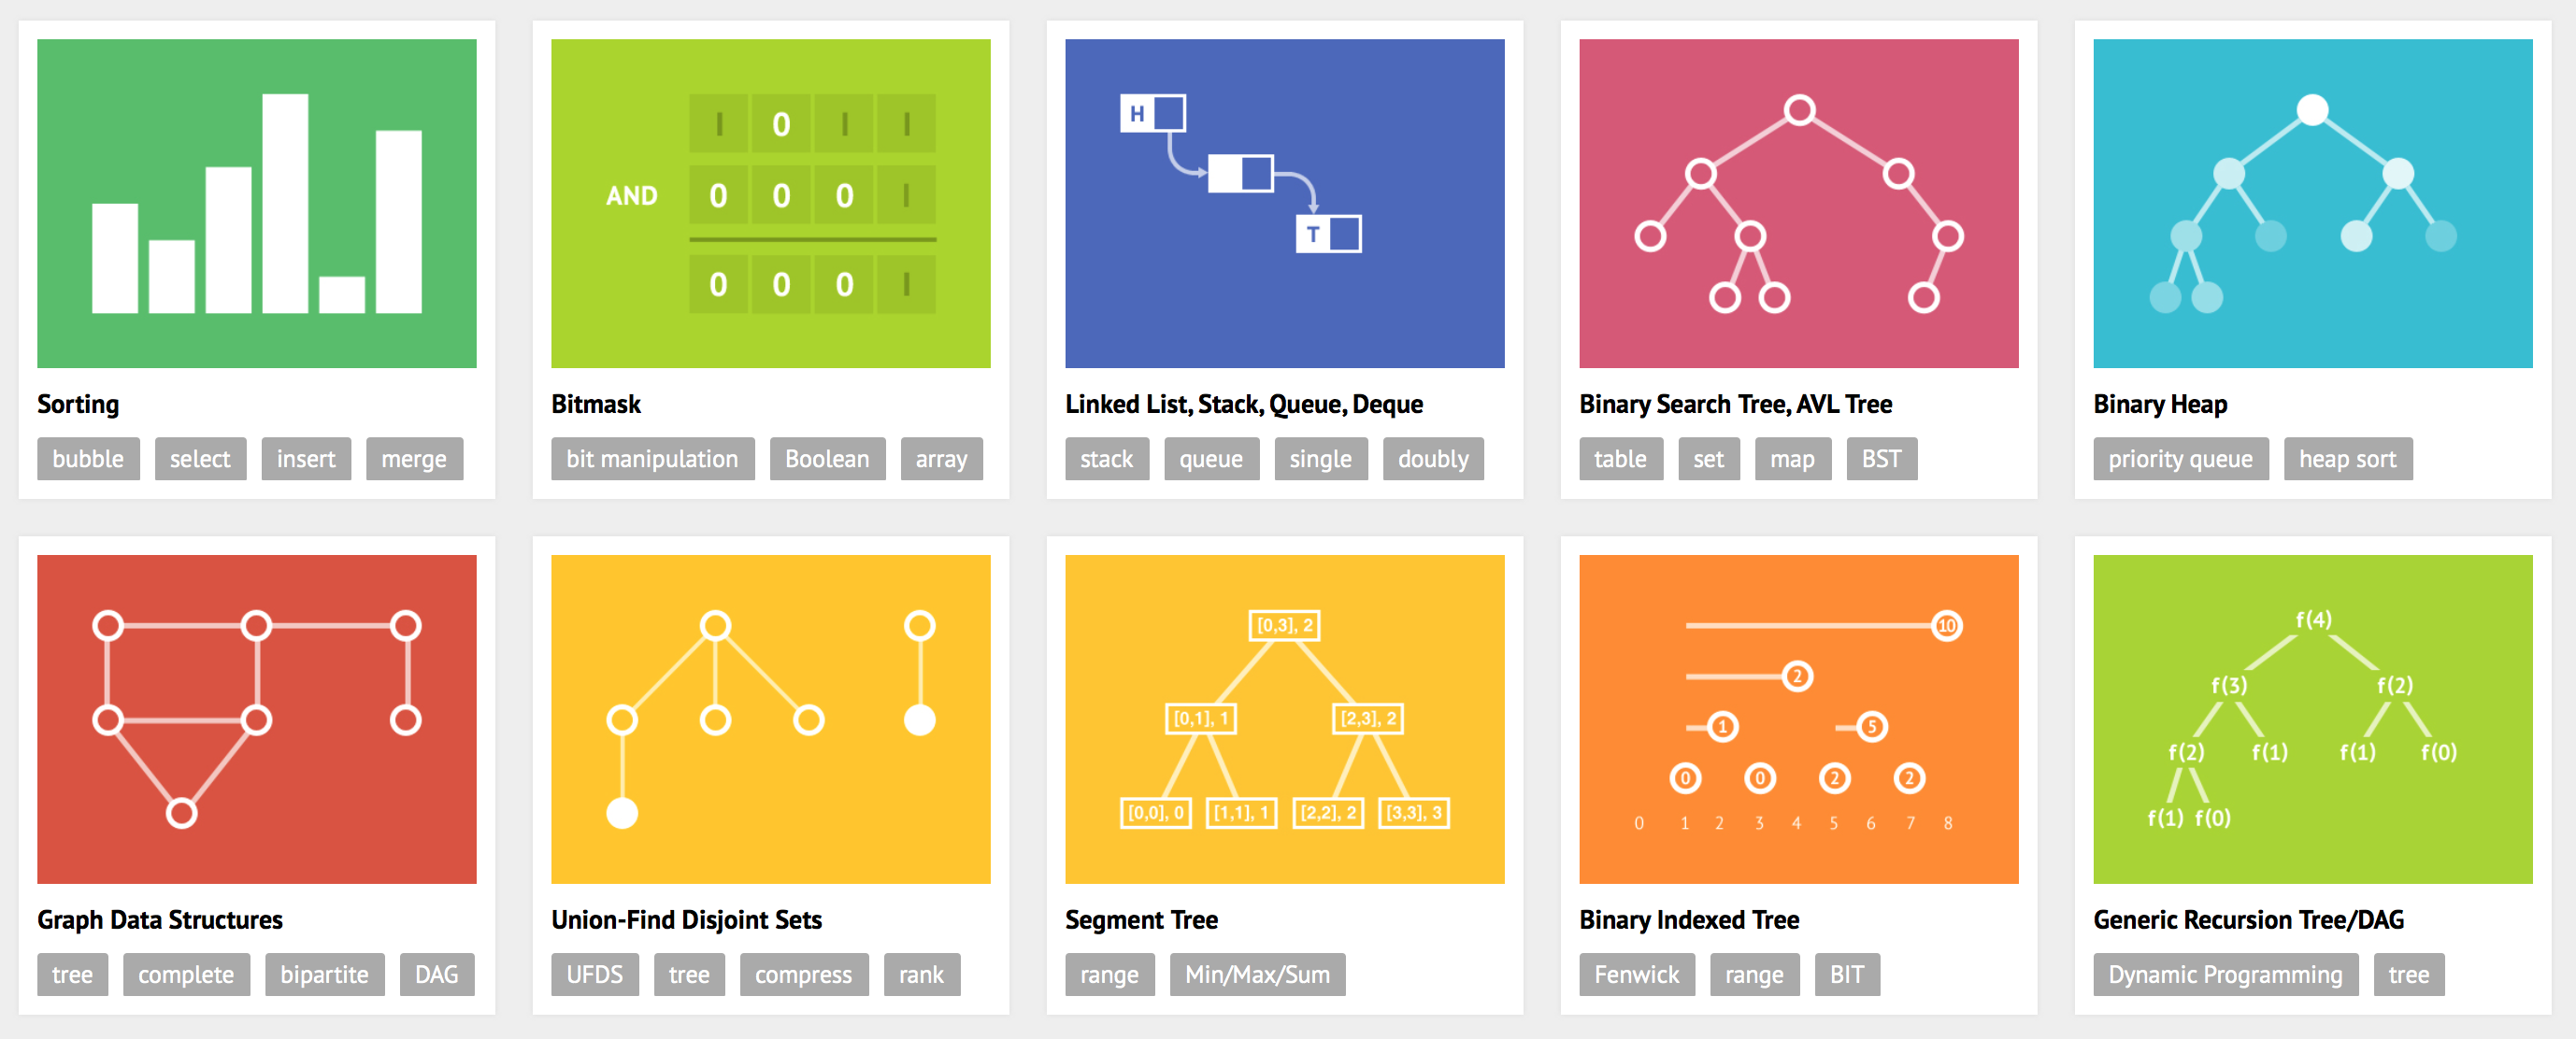
VisuAlgo – Visualizing Algorithms
VisuAlgo was conceptualised in 2011 by Dr Steven Halim as a tool to help his students better understand data structures and algorithms, by allowing them to learn the basics on their own and at their own pace. VisuAlgo is like a 24/7 copy of himself. Together with some of his students from the National University of Singapore (see the “Team”), a series of visualisations were developed and consolidated, from simple sorting algorithms to complex graph data structures and algorithms, and also string+geometry algorithms.
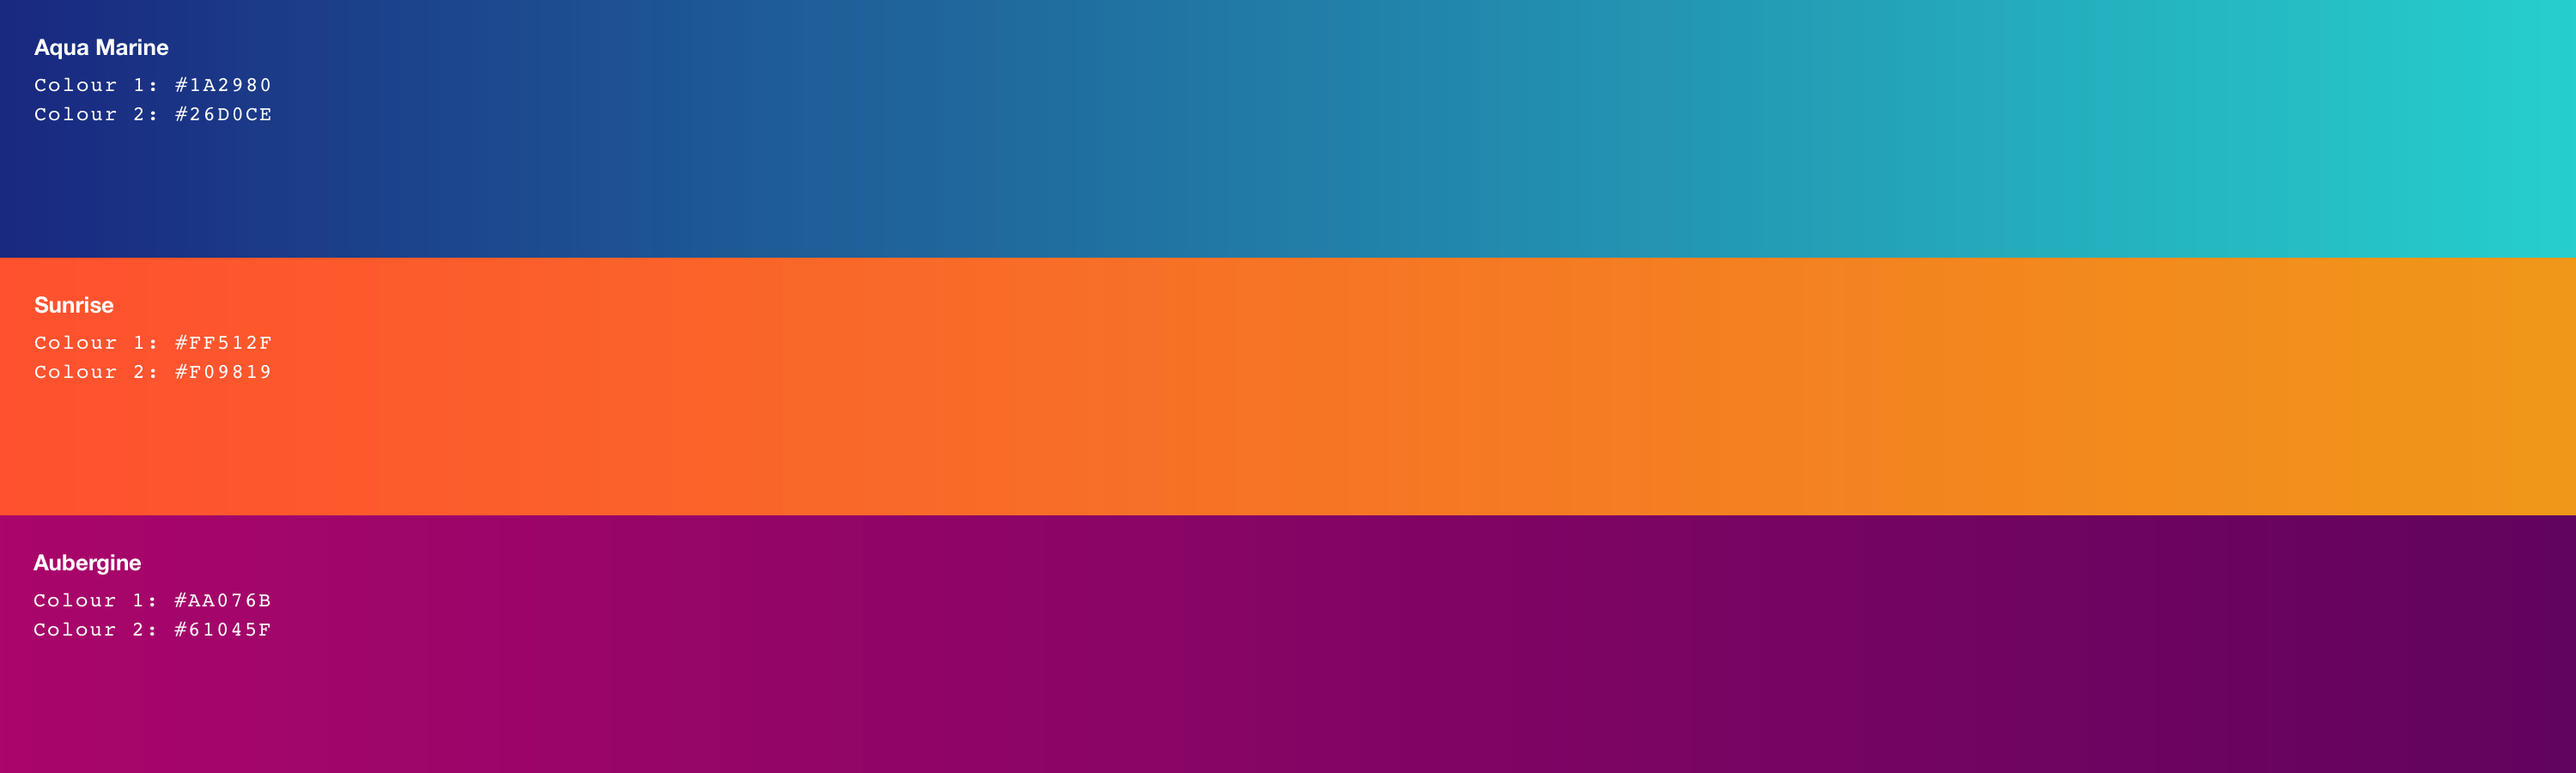
UI Gradients
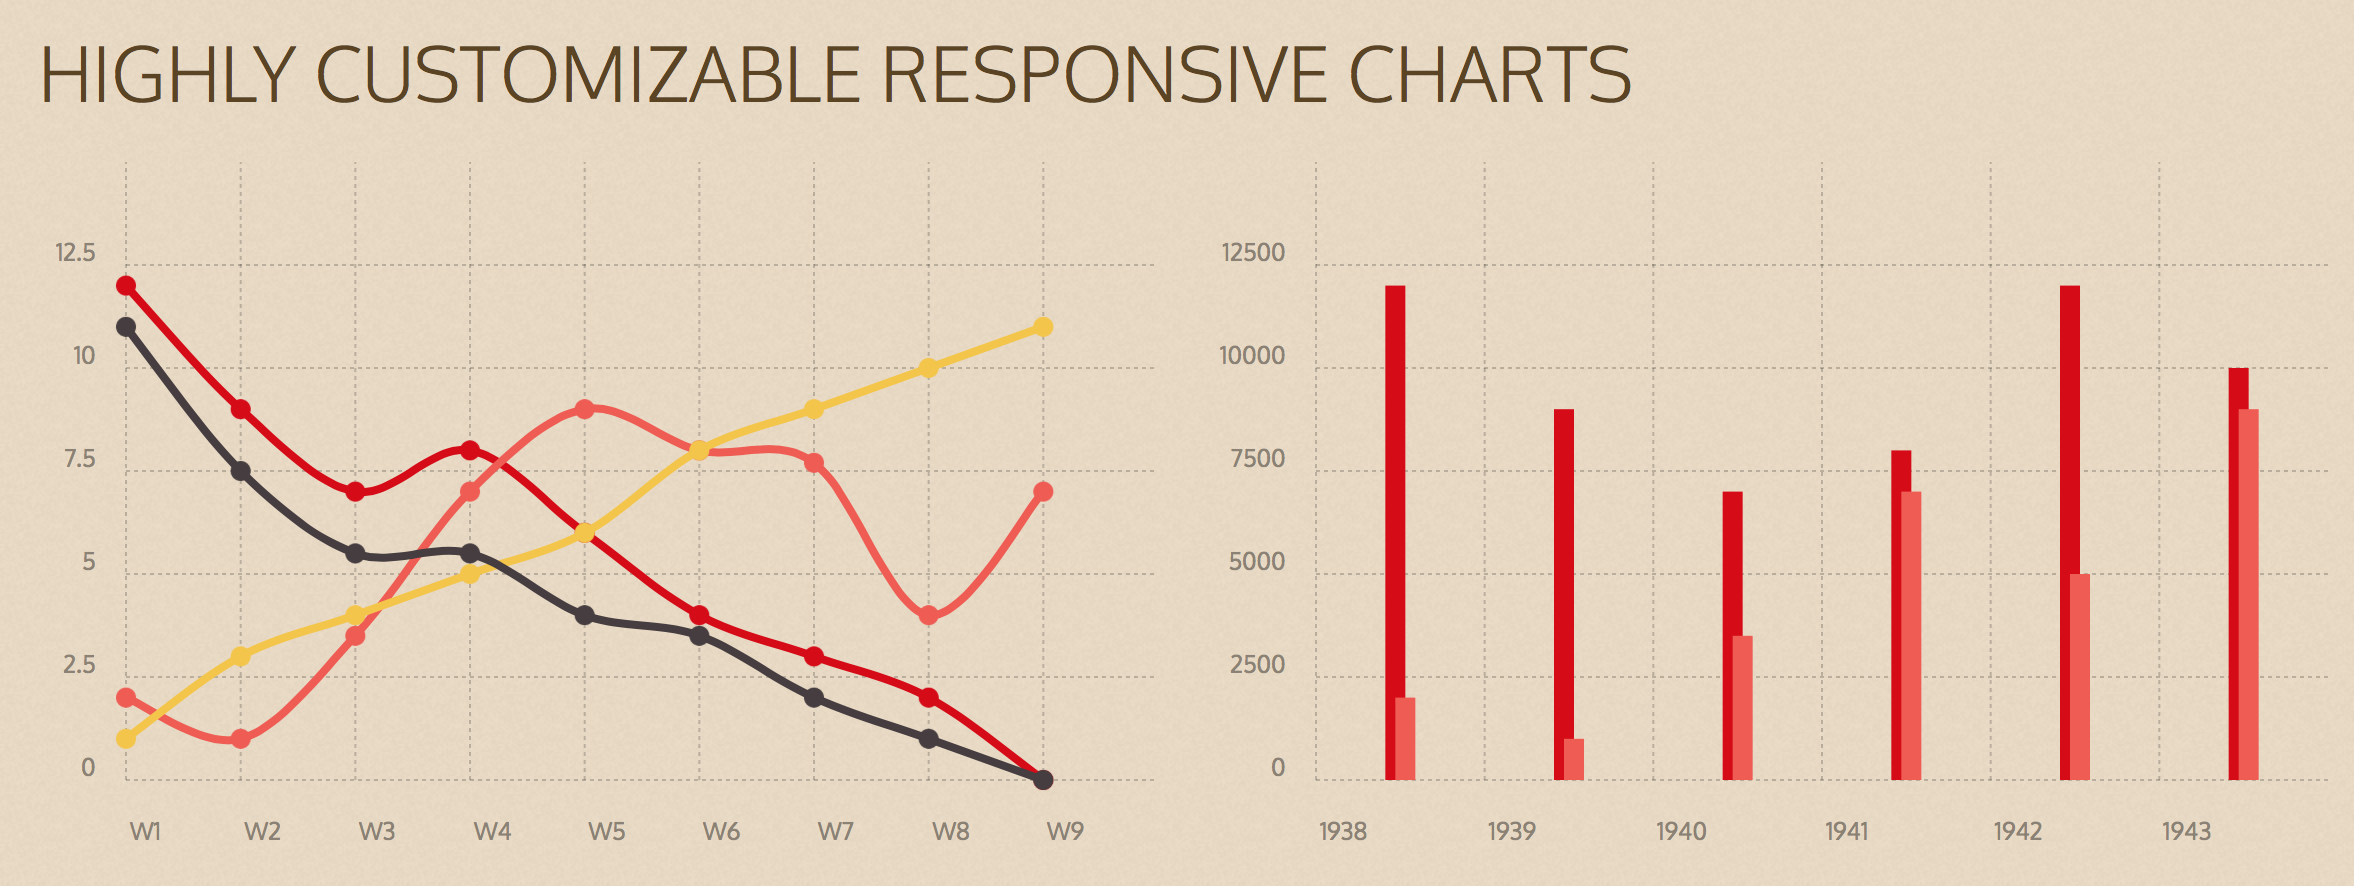
Chartist – Simple Responsive Charts
Chartist.js is a simple responsive charting library built with SVG. There are hundreds of nice charting libraries already out there, but they are either:
- not responsive
- use the wrong technologies for illustration (canvas)
- are not flexible enough while keeping the configuration simple
- are not friendly to your own code
- are not friendly to designers
- have unnecessary dependencies to monolithic libraries
- more annoying things
That’s why we have started Chartist.js and our goal is to solve all of the above issues.
SVG Loading Images

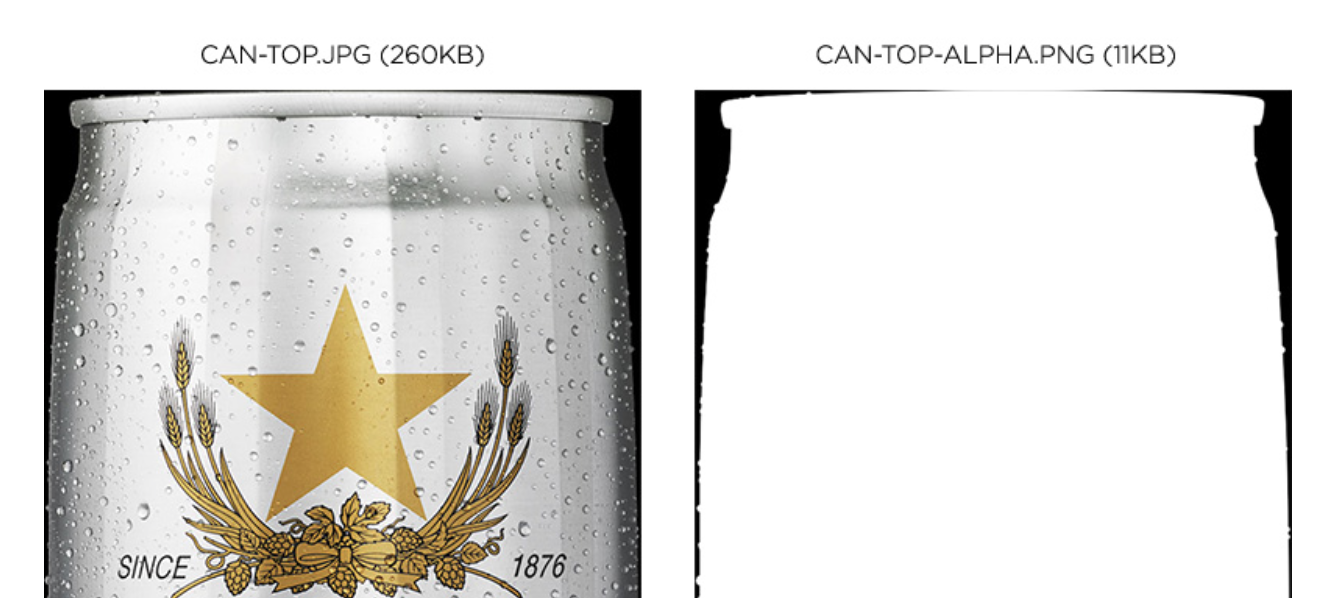
USING SVG TO SHRINK YOUR PNGS
SVG trick with .jpg and .png mask – make big .jpgs have transparent areas
First, I created two files. The first is a regular JPEG without any transparency. You can compress this one as much as you like. The second is an 8-bit PNG (alpha mask). This is just a black and white image that represents the transparent areas of the beer can. Notice how the PNG is only 11KB; that’s because it contains so few colors and no transparency.
<svg preserveAspectRatio="xMinYMin" version="1.1" xmlns="http://www.w3.org/2000/svg" xmlns:xlink="http://www.w3.org/1999/xlink" viewBox="0 0 560 1388">
  <defs>
    <mask id="canTopMask">
      <image width="560" height="1388" xlink:href="img/can-top-alpha.png"></image>
    </mask>
  </defs>
  <image mask="url(#canTopMask)" id="canTop" width="560" height="1388" xlink:href="can-top.jpg"></image>
</svg>